← Back to projects 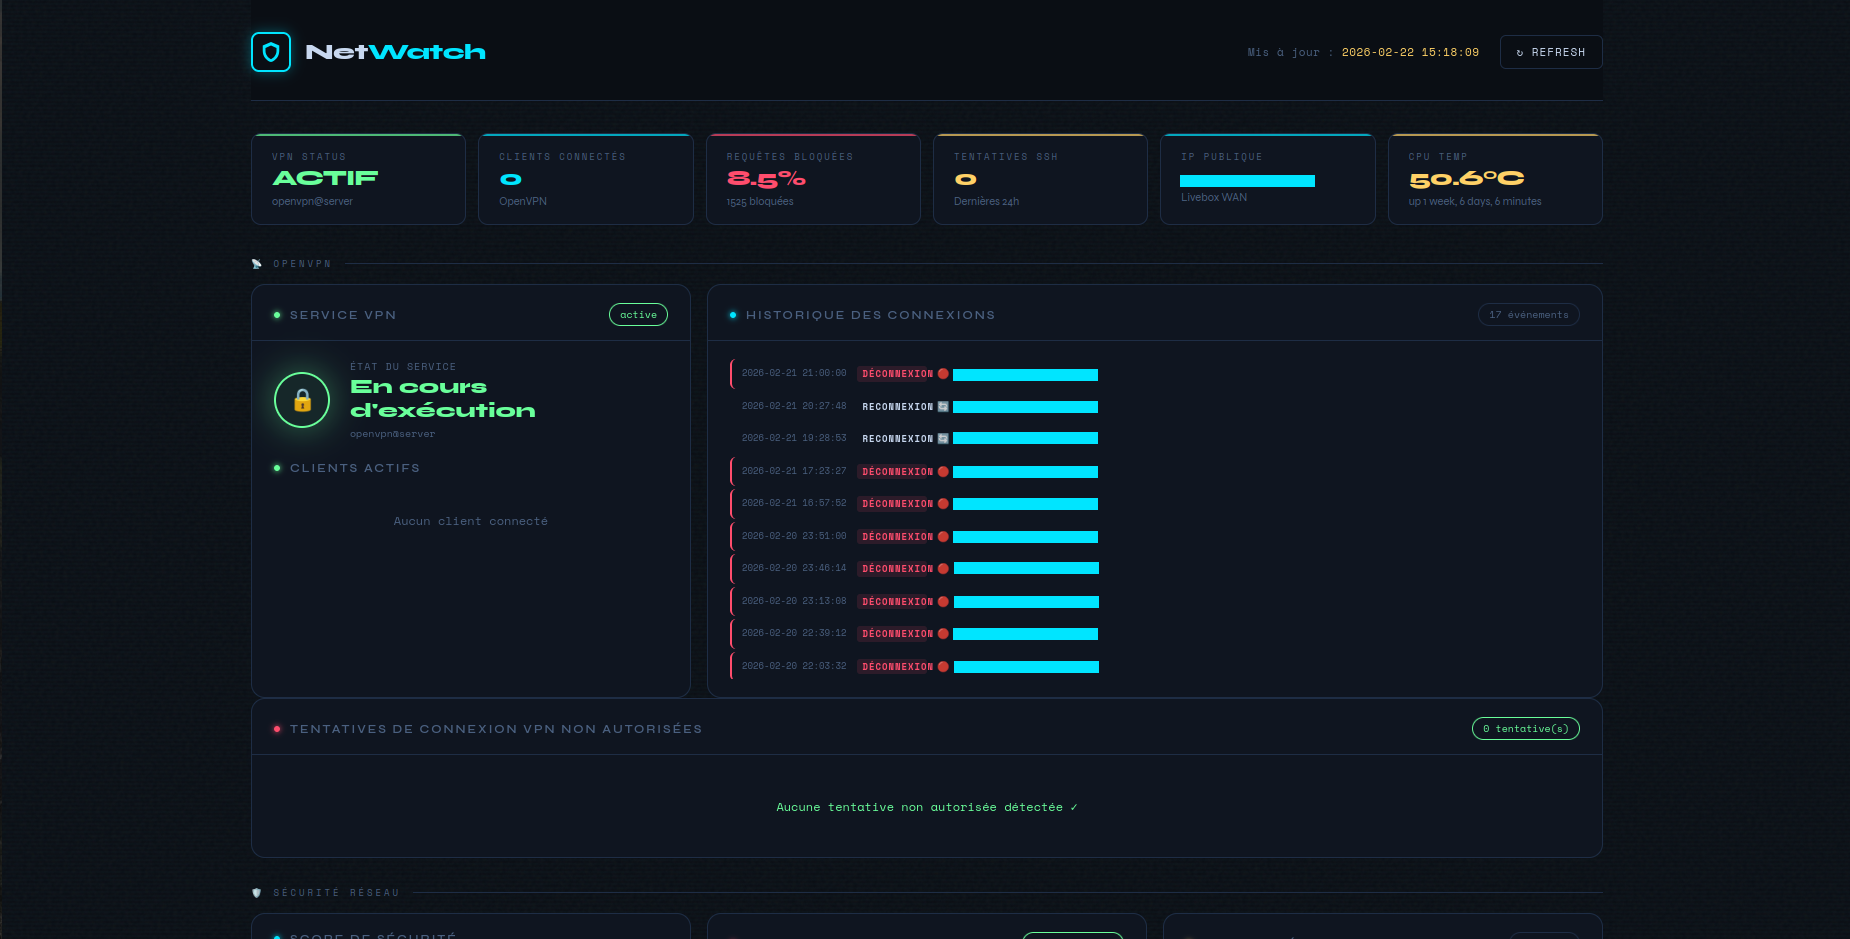
Infrastructure In progress
NetWatch — Raspberry Pi Network Dashboard
Network monitoring dashboard for Raspberry Pi: OpenVPN, Pi-hole and network security supervision from a local web interface.
Network monitoring dashboard for Raspberry Pi: OpenVPN, Pi-hole and network security supervision from a local web interface.
Managing a dedicated Raspberry Pi hosting Pi-hole and PiVPN, I needed a quick way to check VPN status, DNS stats and system security without going through SSH commands. NetWatch is a local web dashboard that centralises all this information on a single page, auto-refreshed every 30 seconds.
Service status, currently connected clients (name, IP, traffic, connection time), connection/disconnection history, unauthorised connection attempts.
Real-time DNS statistics, block rate, top blocked domains. Authentication against the Pi-hole v6 API is handled automatically via /etc/pihole/cli_pw — no manual configuration required.
Calculated security score, Fail2ban jail status (active jails + banned IPs), failed SSH attempts over the last 24 hours, listening ports.
CPU temperature, RAM and disk usage, uptime, public IP.
status-version 3), Pi-hole API, system tools (ss, fail2ban-client, vcgencmd)Using the system Flask package rather than a virtualenv is intentional: it avoids any additional dependency management on a machine whose configuration is already quite loaded.
The project includes an install.sh script that:
/opt/network-dashboard/sudoers-dashboard file)git clone https://github.com/hauserpierre/netwatch.git
cd netwatch
sed -i 's/pi/YOUR_USER/g' network-dashboard.service sudoers-dashboard
sudo bash install.shThe dashboard is then accessible at http://<PI_IP>:5000 — from the local network or via VPN only.
The backend searches for the OpenVPN status file in several common locations (/var/log/openvpn-status.log, /etc/openvpn/server/openvpn-status.log, etc.) to adapt to different configurations without manual setup. The status-version 3 format (tab-separated CLIENT_LIST lines) is parsed natively.
Port 5000 is open only for the local subnet and VPN subnet via iptables, persisted with netfilter-persistent. The dashboard is never exposed to the internet.