Observability & Infrastructure as Code
OpenTofu to drive the cluster, VictoriaMetrics + Loki + OpenTelemetry + Grafana to watch it
Motivation
After two years the cluster was running but driven by hand: helm upgrade and kubectl apply commands documented in READMEs, no view of what was happening inside, and self-signed certificates that mobile apps refused. The goal of this step: get closer to a production environment, with infrastructure as code, monitoring and a real TLS chain, without exceeding the RAM of four Raspberry Pi.
OpenTofu: the cluster described as code
OpenTofu is the community fork of Terraform. The tofu/ directory describes the cluster’s namespaces and Helm releases with the kubernetes and helm providers.
Adopting what exists without recreating it
The tricky part: the services were already running. Instead of redeploying everything, the existing resources (namespaces, Gitea, Immich and NFS provisioner releases) were imported into the state through import blocks. The first tofu apply ran a helm upgrade with identical values: the Helm revision increments, no pod restarts.
Since then, tofu plan detects drift: a release changed by hand shows up in the diff.
Layers behind flags
New layers are enabled one at a time with variables: deploy_monitoring, deploy_authentik, deploy_teleport. Each phase is independent and reversible, and the deployment plan lists the RAM budget of each (about 2.5 GiB for monitoring, 2.3 GiB for Authentik).
Some pieces deliberately stay outside OpenTofu: Traefik, managed by K3s itself (two owners would fight), and NewFlix, deployed by the Gitea CI/CD.
No secret or IP in the repository
Values files contain placeholders (${INTERNAL_DOMAIN}, ${NODE_IP}, ${NFS_SERVER_IP}). A render.tf file substitutes them from a gitignored terraform.tfvars, and the same mechanism serves the manual workflow through a render.sh script. The OpenTofu state is local and gitignored too, since it holds rendered secrets. A pre-commit hook blocks any leak.
Observability: metrics, logs, dashboards
Nodes / Pods
  ├── node-exporter (DaemonSet)      → system metrics (CPU, RAM, disk, temperature)
  ├── kube-state-metrics             → K8s object state (pods, PVCs…)
  └── OpenTelemetry Collector        → log collection from every pod
        ├──▶ vmagent ──▶ VMSingle    → metrics storage (NFS 8 GiB, 3 months)
        └──▶ Loki (OTLP endpoint)    → log storage (NFS 20 GiB, 31 days)
                └──▶ Grafana         → dashboards and exploration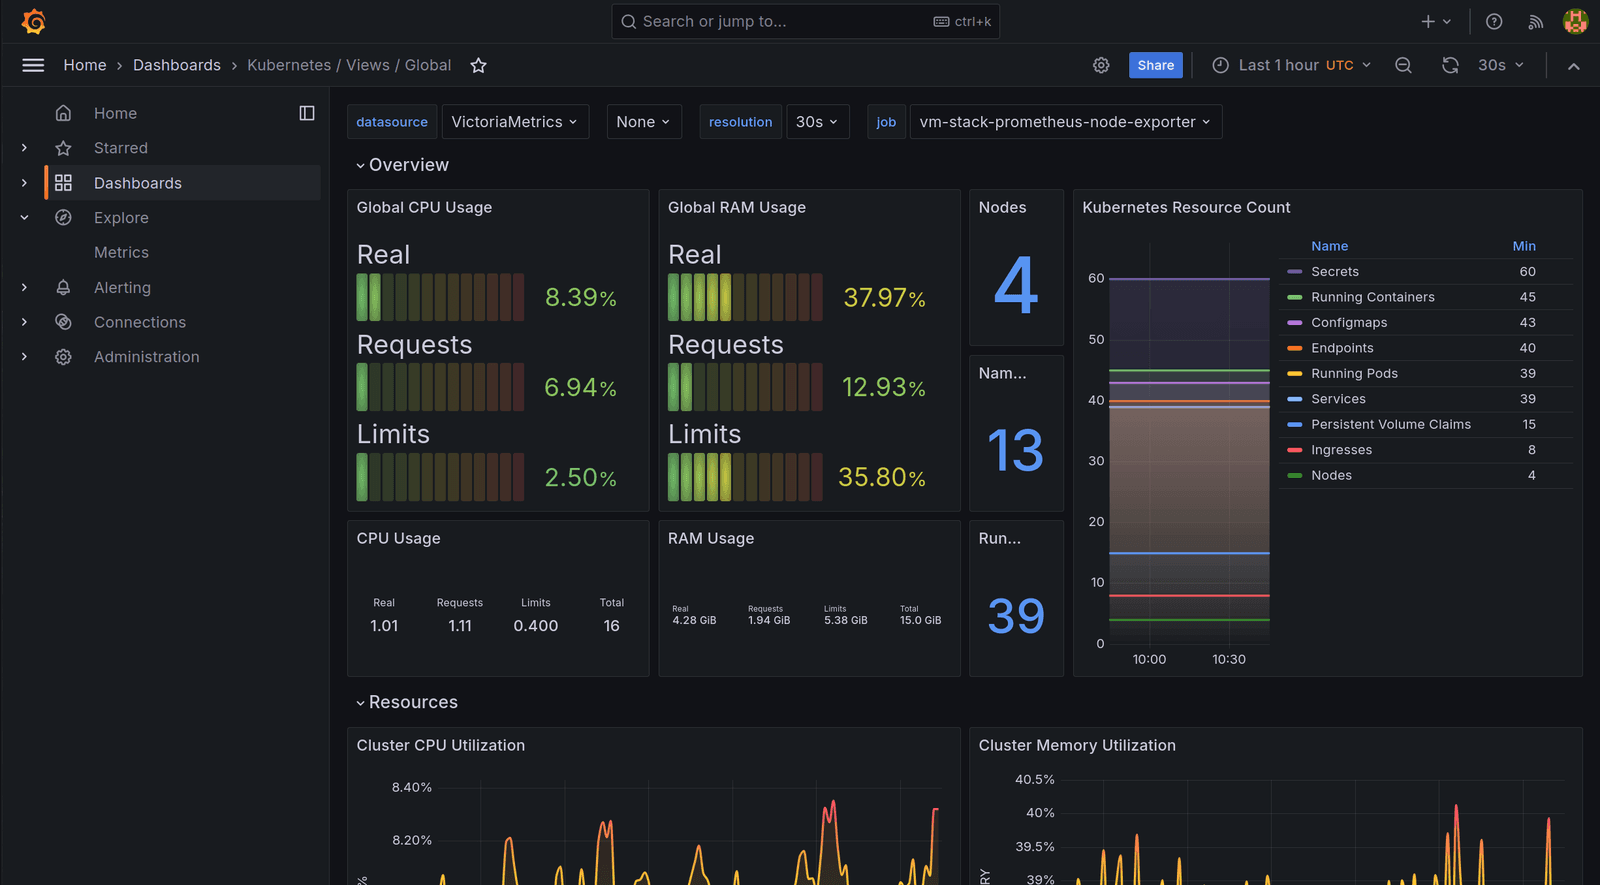
The cluster’s global dashboard in Grafana, VictoriaMetrics datasource: 4 nodes, 39 pods, 38% of 15 GiB RAM in use.
VictoriaMetrics rather than Prometheus
Same query language (PromQL), same scrape formats, but far lighter on RAM and disk: on Raspberry Pi that is what makes the difference. The victoria-metrics-k8s-stack chart brings VMSingle, vmagent, node-exporter, kube-state-metrics and Grafana. Any Service annotated prometheus.io/scrape is discovered automatically; Gitea already exposes its metrics that way.
Loki in single-binary mode
Loki only indexes labels (namespace, pod, container), not the content of the lines, which keeps it very light. Here: a single pod, filesystem storage on NFS, memcached caches disabled because they asked for more RAM than a whole Pi.
OpenTelemetry Collector instead of Promtail
Promtail is deprecated (end of life March 2026). The OpenTelemetry Collector does the same job, a DaemonSet reading /var/log/pods on each node, with two advantages: it is a vendor-neutral standard, and an application instrumented with an OTel SDK can send it logs and traces over OTLP without touching the infrastructure. The kubernetesAttributes preset enriches every line with Kubernetes metadata, and export goes to Loki’s native OTLP endpoint.
Pitfalls met along the way
no locks available: VMSingle in CrashLoopBackOff
The NFS share is mounted as NFSv3 without a lock manager, so flock() fails. VictoriaMetrics takes a lock on a flock.lock file and panics when it cannot get it; Grafana hangs on its SQLite database for the same reason. Fix: a second StorageClass, nfs-cluster-nolock, with the nolock mount option, created by OpenTofu. The NFS client then handles locks locally, which is safe here since these volumes are ReadWriteOnce, a single pod writes to each. Loki does not need file locks and stays on the standard class.
Bootstrapping with -target
Grafana reads its admin credentials from a Secret that must exist before the pod starts, and the Secret does not go in the repository. The sequence: create the namespace alone with tofu apply -target, create the Secret by hand, then the full apply. -target stays reserved for this kind of bootstrap.
Namespace stuck in Terminating
When disabling the monitoring layer, the VictoriaMetrics operator is removed before its custom resources: nobody is left to process their finalizers and the namespace never goes away. The VMSingle, VMAgent and friends have to be deleted before flipping the flag to false.
The other layers
- cert-manager + Let’s Encrypt: wildcard certificates obtained through a DNS-01 challenge via the Cloudflare API, renewed automatically. No more browser warnings or mobile clients refusing self-signed certificates.
- Authentik: self-hosted OIDC identity provider, to which Grafana, Gitea and Immich delegate authentication.
- Teleport (planned, not deployed yet): access bastion with short-lived certificates, audit and recording of SSH and kubectl sessions. The layer is written behind its flag, it still has to be enabled.
- Coraza WAF + OWASP CRS: Traefik plugin, optional and not wired by default. On a cluster not exposed to the internet its value is mostly educational, and the docs say so.
Result
The cluster is described as code, drift is visible, and every new building block is enabled by a flag with a known memory budget. Grafana shows the temperature of each Pi, pods restarting in a loop and the logs of any namespace in one query. All of it documented in the repository, technology primers included, so it can be rebuilt from scratch.